Collecting data is a task or chore that befalls any graduate student hoping to develop a thesis, or researcher preparing a paper. Some hate collecting data, others love it, and some are indifferent.
Regardless of your feelings, it is difficult to produce a dissertation or paper without data. In this blog, I’d like to address the “data collection experience” with two stories. The first is a narrative of how I learned to approach observation, while the other is an account of a data collection project from the Education 702A/B course. My reason for sharing details of this project, called Dear data, are its practical and philosophical applications to data collection and representation. I will start however, with a humbling data collecting story from my undergrad.
While attending St. Mary’s University, I conducted a summer research-project examining mucous cells in larval salmon skin. I picked up some observations tricks from my lab mates and in just six-weeks, I thought I knew everything about biology research. Fortunately, the supervising professor graciously provided me with a well-timed and valuable data collecting lesson. I remember the encounter vividly. I was sitting in the lab, smugly reviewing the data I had gathered over the summer and I boasted to my lab mates, “I have all the data I need.” The professor overheard my unenlightened comment and then beckoned me into his office.
“So, you think you’re done?” he said as he reclined in his chair.
“Yes” I said confidently.
“You need to get back on that scope and look” he replied. There was a pause and he leaned forward.
“You’re not finished. You found what you were looking for. Now you need to find something new.”
“What am I going to find?” I replied.
“Just look” was his simple and insistent answer. I later realized this was sage advice.
Over the next few days, I was engaged with “looking.” I reviewed all my microscope slides and found two types of secretory cells and a “rodlet cell” all of which, had never been reported in larval salmon skin.
The data collecting lesson is this: carry an open mind and free all your senses within your data collection experience. If you look deeply and beyond the surface, discoveries are waiting. Novel observations will not fall upon eyes focused on the singular, nor will unique phenomenon, be perceived by a mind seeking confirmation. So, just look. The best advice I have been given to date.
Now, the Dear data project.
Last term, the Education PhD students were assigned a collaborative data collection project, Dear data, as part of the Education 702A/B course. This class project was based upon a year-long data collecting and sharing project, conducted by Giorgia Lupi and Stefanie Posavec (www.dear-data.com/theproject). For a year, they collected different forms of personal data every seven days with this twist: the data had to be represented as art (the form was a personal choice). As part of our Education 702A/B project, we were required to collect data for three weeks and share our data-art representations with a partner. I was skeptical. How could I use art to represent data? I am a fish biologist and science teacher and I want my graphs!
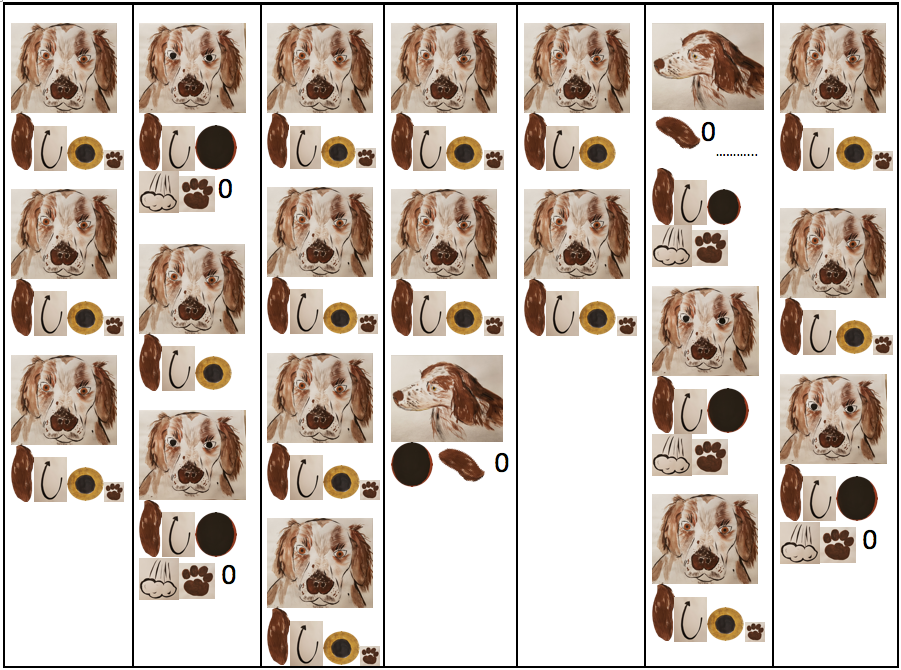
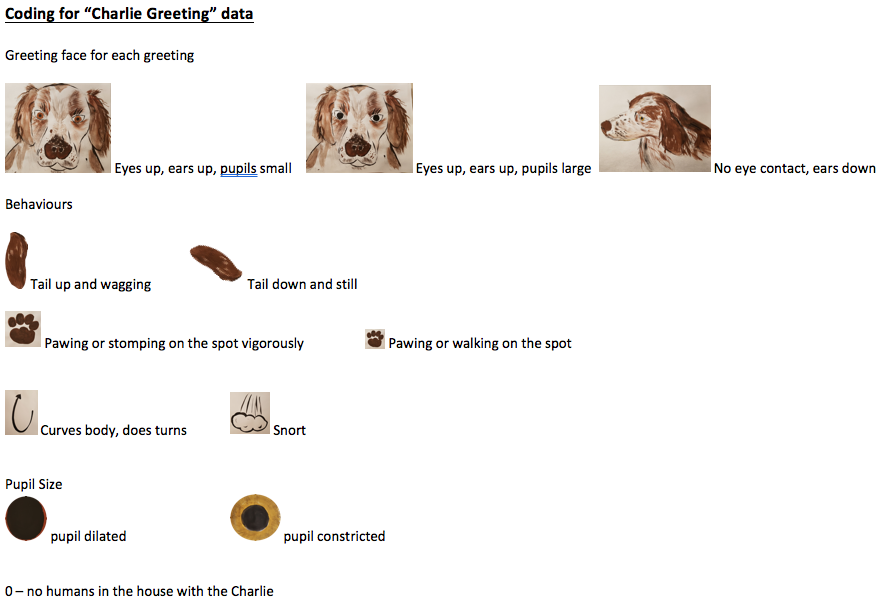
I committed to the project, collected my data, and set up a table with paper, colour markers, pastels, color pencils, and water colours. I started slowly and my art progressed. The image below represents a week of observations of my dog’s greeting behaviours at my front door. I suggest you look closely, use an open mind, and try to figure out what the images represent. If you get frustrated, check the next image which contains the codes that explain how the art represents data.
Image 1 – Charlie’s greeting behaviours at my front door
Image 2 – The data codes for a week of Charlie’s greeting behaviours at my front door.
The art representation was an important challenge but, it was not the most important feature of this project. For me, the art became the medium for collaborations with my project partner. Our collaboration produced reflections on the manner of my data collection, why I collected the data, and the form of expression chosen for the data. These are important considerations for any research.
My project partner was an important audience for my work; a vital source of comments to queries for the choice of data collection methods and data representations. Our interactions fostered an understanding of my partner’s perspective on the data and how I was projecting a data story to her and other readers. After our meetings, I would reflect on the data representations and my partner’s comments. This helped me appreciate how a viewer may struggle to interpret my representation of the data. My resolution was simple: the reader should not have to struggle with data interpretation.
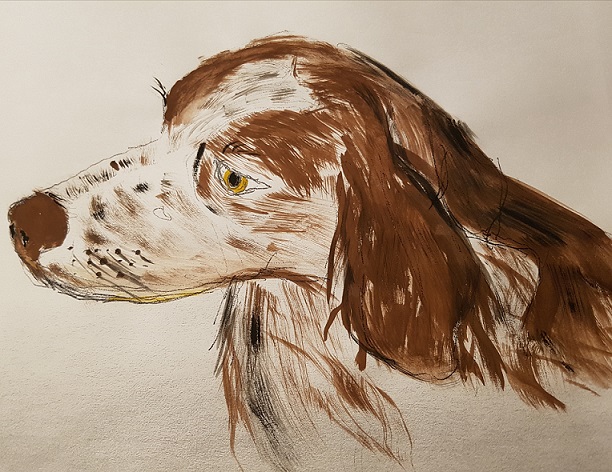
In my opinion, the seminal goal of art and writing is to convey a message from the artist or writer, to the viewer or reader. Granted, each individual will have their interpretation, but my goal within the project process was clarity. In the past, I have overlooked this simple goal by using overly technical writing which, muddied the meaning of my message. Further, I have written in a cryptic manner in an attempt to be clever, resulting in writing that was imperceptible to some readers. The collaborations of Dear data helped to both find and address this problem, while improving my artistic representations of the data for this project. At the end of the project process, I found my highest level of personal satisfaction in the final data representation (see below). In this representation, I resolved my desire for artistic Realism with the practicality of data representation that is less challenging to interpret (if you know dog behaviour). The process continues and, for a researcher, the decision of how to best present data for readers will never end.
Image 3 – Charlie avoiding eye contact, submissive posture.
My belief is that we should challenge ourselves to produce unique data representations that are both clear and engaging for viewers (for example, some may find the above image aesthetically pleasing). The engagement goal parallels our need to captivate more readers by writing clearly and directly, then continually reinforcing the message we are attempting to convey within our writing. My goal as a writer and artist is to produce accurate representations using writing or art that foster both engagement and understanding in the viewers. In the end, data is important but without proper representation and explanation, it will not tell a story that will attract readers. With more readers to consuming our work, we become a greater part of the social construction of knowledge, and that is a place I want to be.
Until next time…
~Patrick
Suggested reading: Dear data. G Posavec & S. Lupi. (on reserve in the Health Science Library or buy it on Amazon!)


